I began my love affair with data and computers in college in the mid-1970s, programming on an IBM mainframe with punch cards. From my residency through my time as Chief Medical Officer of a hospital, I stayed involved with innovation in the realm of data and information technology.
Eventually, I decided to dive completely into the world of health care data analytics. Nothing makes me happier at work than to be knee deep (or deeper) in data. Whether it’s assessing quality, answering a question or solving a problem toward improving population health. That’s really the heart of my work now – proving to clients that we’re improving the health of their population.
What is health?
Describing health to our clients isn’t easy. We have terabytes of data about our members. We can tell them about the prevalence of chronic conditions. We can point out lifestyle and biometric risks. We can describe clinical outcomes. We can identify gaps in care. We can literally show tables and tables of data. At the end, they have trouble putting it together and still don’t really understand what all of that means for the overall health of their population. We needed some sort of metric that could simplify, aggregate and describe health.
The Spectrum of Health
The Spectrum of Health was our first attempt. It looked at episodes of care and put members in one of 6 categories:
- Healthy
- Healthy with risk
- Minor chronic conditions
- Major chronic conditions
- Complex chronic conditions
- Catastrophic – high-cost claimants
We described the health of the population by how members fit in those categories. Notice that by and large, we were looking only at physical health. And we viewed wellness in terms of lifestyle risks and other health issues that can be risk factors of chronic conditions, like cholesterol, smoking and stress.
The shortfall of the spectrum was that it’s not an outcomes measure. People thought we were going to shift their population from less healthy categories to more healthy categories. Not true. Think about a person with kidney disease. We can help them manage it, but we’re not going to cure it and move them out of the major chronic category. So, while the spectrum gave us a picture of health, it wasn’t the metric we were looking for.
Multi-dimensional health
Now, the hot topic in our industry is well-being. The concept of well-being says that it’s not enough to be just physically healthy. There are other factors – emotional health, social connectedness, financial security and so forth. But even just within the category of physical health, we can still look at it in terms of a multi-dimensional perspective.
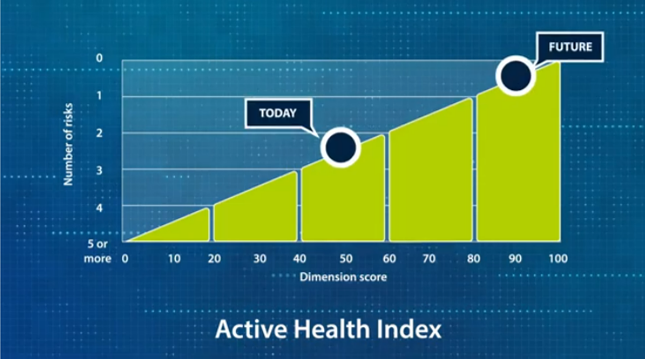
This thinking led us to develop the Active Health Index. It’s a much more sophisticated tool than the Spectrum of Health and considers ten dimensions of health – six of which are impactable. The Active Health Index addresses three fundamental questions of interest to our clients.
- What is the health of my population?
- What are the opportunities to improve their health?
- How much did health improve between two points in time?
So, not only does it measure health, but it’s an outcomes tool as well. We can measure the changes we are making in the impactable dimensions over time. We’re excited about it, and so are our clients.
Check yes or no
Our patented CareEngine® technology is the foundation of the Active Health Index. It ingests a massive amount of information about our members and creates an enormous, longitudinal database.
All of this data passes through thousands of clinical rules. We distill it into markers. Markers are basically a yes/no about things related to a member. Are you a smoker – yes or no? Do you have diabetes – yes or no?
We took all of these markers and looked at the most logical way to organize them. What we saw was that they seemed to fit naturally into ten dimensions. There are four non-impactable dimensions – things we can’t change but that do impact your overall health, like your age. The other six dimensions are impactable. They’re things like medication adherence and lifestyle and biometric risks, even the member’s self-perception of health.
At ActiveHealth, we believe in a personalized approach to population health. We know that members with diabetes don’t all need exactly the same support. The Active Health Index helps identify areas for improvement that are specific to each person. This data threads through every interaction the member has with us. It prioritizes what appears to the member in our digital experience. And it’s part of the individual care plans that our coaches and clinicians develop for our members.
As members act on their opportunities for improvement, we can see it. We can measure the change over time, and we can report on it at a population level to our clients. It gives them a simple, aggregated picture of the health of their employees. From there, they can create the population health solution that will have the most impact on the health and well-being of their employees.
If the key to successful population health management is what you know and how you use it, the Active Health Index can be the foundation of both.


